Page currently under construction
Currently being updated
All information is shown, but pardon the organization
Currently being updated
NASA SEES 2021
Summer 2021: I had the opportunity to learn about remote sensing and satellite imagery for emergency preparedness through an internship with NASA and the Texas Space Grant Consortium. As a resident of the Bay Area, I’ve had firsthand experiences with increasingly catastrophic wildfire seasons, and I wanted to learn how I could address this pressing issue through technology. After learning about and implementing algorithms and machine learning, most notably the “random decision forest” for land classification, I created a California wildfire vulnerability map of California. Over the course of a month, I analyzed satellite imagery and datasets provided by NASA through Google Earth Engine, wrote my own algorithm for the vulnerability map, and presented my findings in the NASA SEES Science Symposium. I am the first author of my group’s abstract, which is now published by the American Geophysical Union. I worked on writing and putting together the entire submission and communicating with AGU to have our poster presented at the upcoming AGU 2021 fall conference.
I was selected to be an intern for the NASA SEES 2021 program, specifically on the Emergency Preparedness team.
-
Analyzed remote sensing data for emergency preparedness through this selective internship with NASA and the Texas Space Grant Consortium. I was one of 10 high school students selected nationally to participate in this emergency preparedness team.
-
Programmed California wildfire vulnerability maps: analyzed NASA satellite imagery using Google Earth Engine, wrote my own algorithm using Python, and presented my work at the NASA SEES Science Symposium
-
Participated in AGU's Bright STaRS program
-
Allowed me to publish the project and present it at AGU's 2021 fall conference
-
-
First author of the project's abstract, which is now published and will be presented at the American Geophysical Union 2021 fall conference.
-
Created all submission materials and poster. Wrote the team's abstract.
-
Documented all of our work in a GitHub repository
-
Links
NASA SEES
From the NASA SEES website:
"NASA, Texas Space Grant Consortium, and The University of Texas at Austin Center for Space Research Summer Intern Program is a nationally competitive and prestigious STEM internship for high school students. It is the only national high school internship that NASA supports. Students will work with scientists and engineers to conduct authentic research from data received from NASA’s Earth-observing satellites as well as designing Mars habitats, Lunar Exploration, and robotics. This nationally competitive program sponsored by NASA’s Texas Space Grant Consortium selects students who will increase their knowledge of science, technology, engineering, and math (STEM) through Earth and space education."
Emergency Preparedness Internship:
“Using Satellites for Emergency Preparedness: Interns will focus on a recent flood, wildfire, or tropical storm events, review satellite image datasets from NASA, the European Space Agency (ESA), and the US Geological Survey (USGS) collected before, during and after the event, and test best practices for rapid mapping of information extraction derived from these data. We will use image analysis and investigate related geospatial information resources with the goal of creating and distributing products for emergency response applications and societal benefit. Past projects have utilized geospatial applications including QGIS, Google Earth Engine, and MultiSpec as well as Python and JavaScript for coding.”

Abstract Results Document

QR Code linked to the abstract
Abstract:
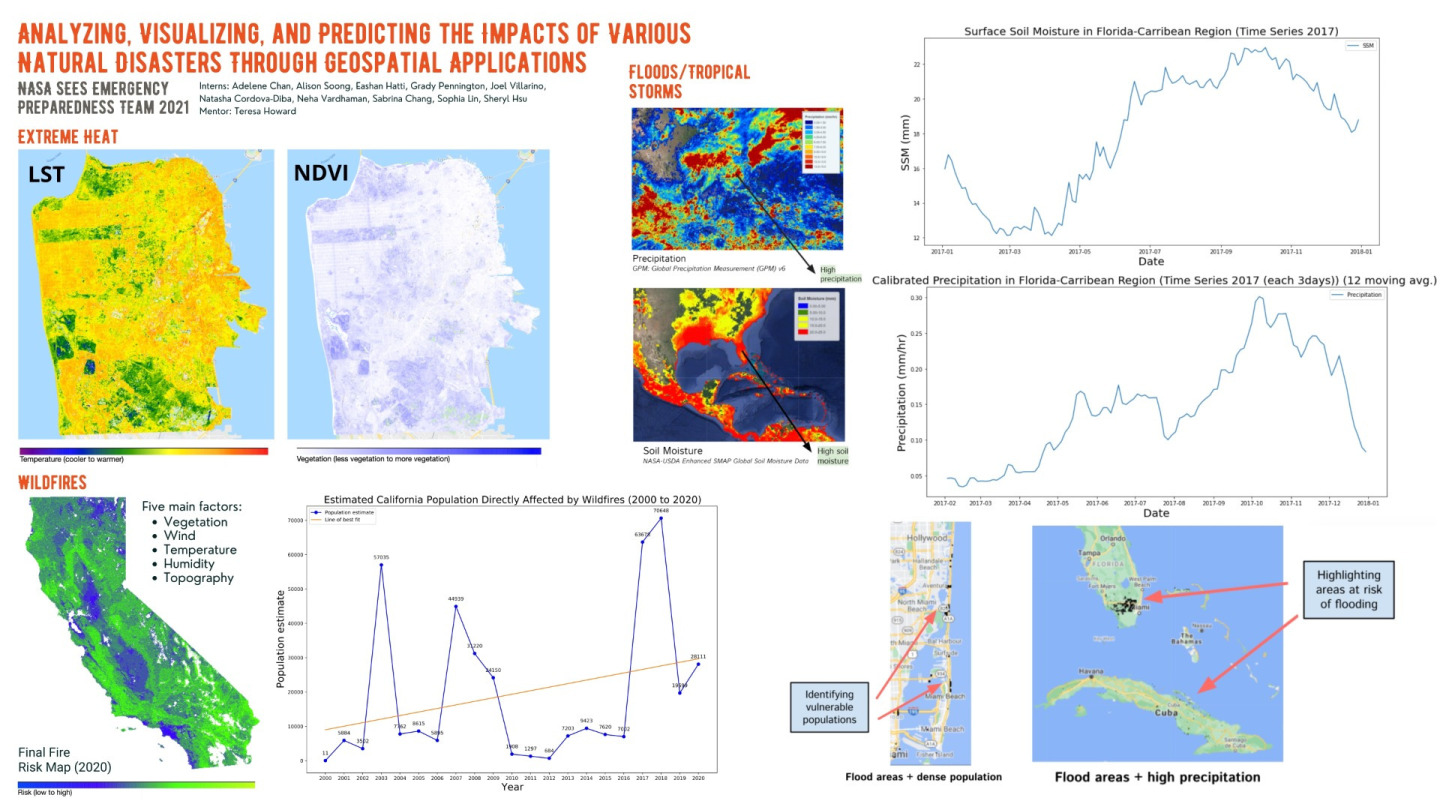
Using population grid datasets, satellite imagery, and geospatial data accessed through Google Earth Engine, we identified patterns between natural disasters, their causes, and their impact on communities in order to predict and identify ways to reduce their effects. Techniques used include resampling, grid manipulation, mapping of datasets, and trend examination by creating time-series graphs and visualizations.
For wildfires, population data was overlapped by burn scar data to calculate the yearly California population directly affected by wildfires (residing in burn areas) from 2000 to 2020. A line of best fit based on the calculated values showed an increase in population affected over time, and notable outliers revealed years with conditions that contributed to wildfire vulnerability, including high vegetation, high wind speeds, high temperatures, low relative humidity, and sloped topography. Scoring and combining data based on these five factors resulted in a fire risk map that visualizes the susceptibility of California to wildfires.
For floods and tropical storms, the hurricane-heavy Florida-Caribbean region was analyzed by processing surface soil moisture (SSM) and precipitation (GPM) datasets to create time series line charts that revealed an upward trend in both SSM and precipitation in the fall of 2017. To examine how susceptible SSM, precipitation, and dense populations were to flooding, we overlapped maps of the various datasets by masking higher values with areas of the map that had flooded. A significant overlap existed with these flood factors, allowing us to generate a map that visualizes areas susceptible to flooding.
For extreme heat, San Francisco was chosen as the area of study. We created land surface temperature (LST) and normalized difference vegetation index (NDVI) images of the city to determine the effect of vegetation on extreme heat events in urban areas. Our observations showed that while greenbelts — large vegetated areas dispersed throughout the city — do have a significant cooling effect, this effect does not spread far beyond the limits of the area. A possible solution is to distribute a greater number of smaller green areas evenly throughout the city instead.

